home: http://taps.cs.princeton.edu 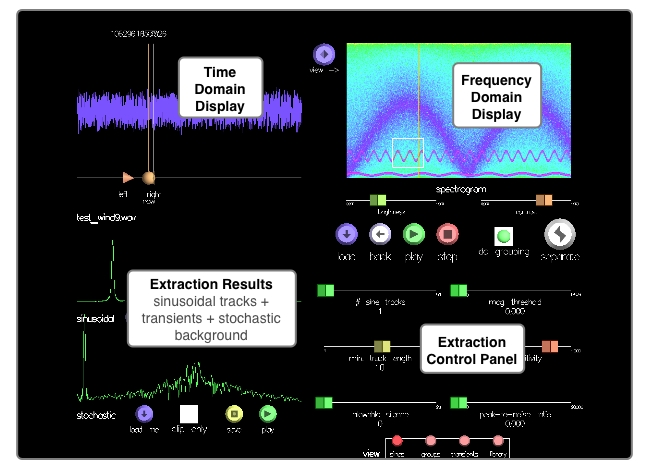
Figure 1 : Analysis interface full-shot Getting started The first steps to loading and playing with a sound recording are:
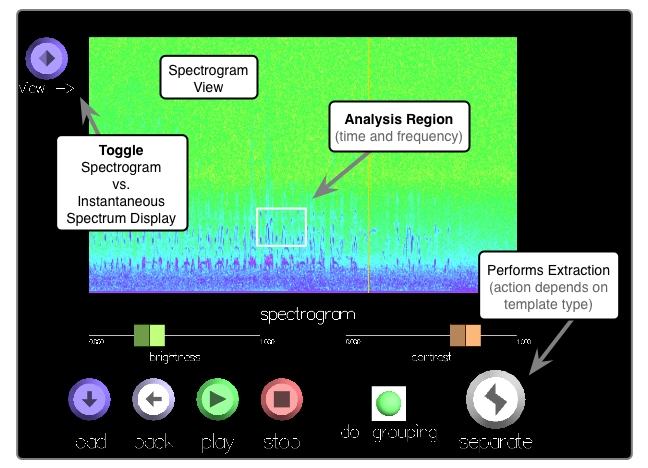
Figure 2 : Zoom in on spectrogram view (by pressing 2). The x-axis of the spectrogram corresponds to time, the y-axis to frequency, and the color to magnitude. Sinusoidal analysis To extract sinusoidal tracks from a selected time and frequency region, hit the separate button while viewing the sines or groups pane. 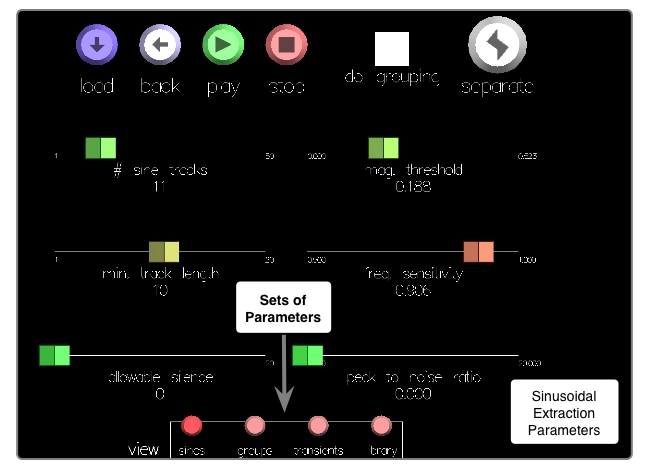
Figure 3 : Sinusoidal analysis pane Sliders in the sines pane control regular sinusoidal analysis parameters such as the number of sinusoidal peaks to locate per frame, and thresholds for peaks and tracks. The parameters are described in more detail here. 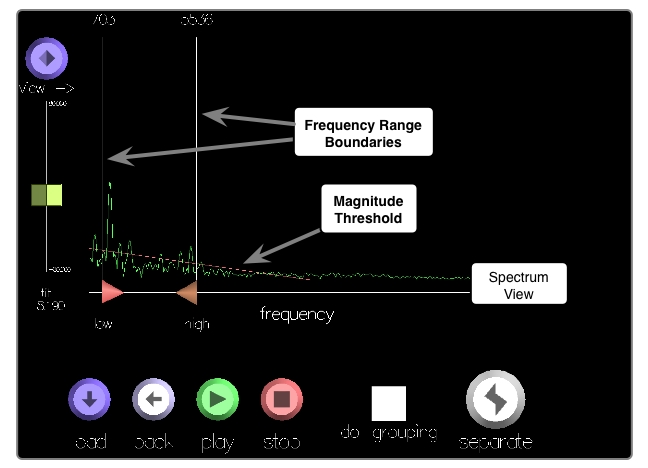
Figure 4: Magnitude threshold in frame-by-frame spectrum view The peak magnitude threshold can be viewed in the frame-by-frame spectrum as a red line (see Figure 4). Only peaks above the line are accepted. While the mag. threshold slider determines the y-intercept of the line, the slope of the line is determined by the tilt slider near the spectrum view. Tilt allows the threshold to be vary across frequency bins. 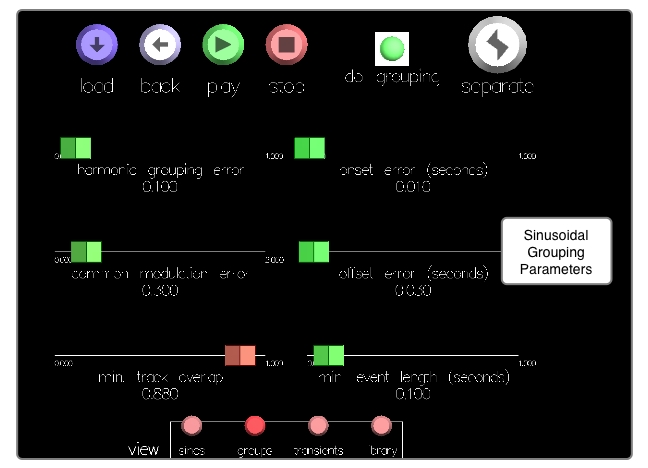
Figure 5 : Sinusoidal track grouping pane Selecting the do grouping box enables the optional sinusoidal track grouping feature. Sliders in the groups pane control the sinusoidal grouping parameters, and can be adjusted to obtain groups based more on one quantity than another. These parameters are also described in more detail here. 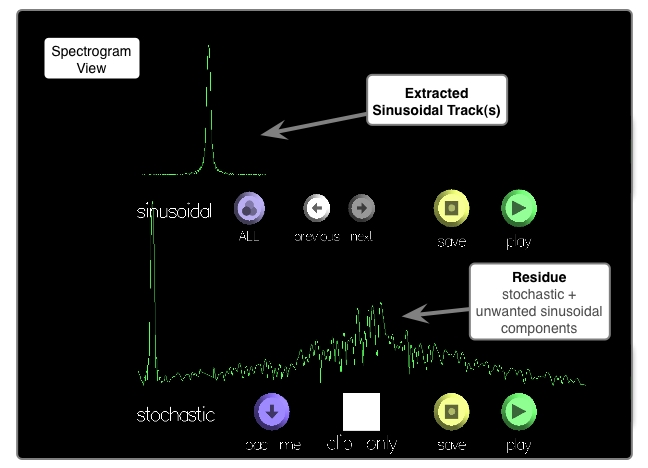
Figure 6 : Sinusoidal and stochastic separation Once all the parameters have been selected and the separate button pressed, sinusoidal analysis is performed. Taps then resynthesizes and plays the extracted sinusoidal component. In the bottom left quadrant of the screen (Figure 6), the sinusoidal spectrum shows a frame-by-frame spectrum of the extracted and resynthesized sinusoidal tracks, while the stochastic spectrum shows a frame-by-frame spectrum of the remaining stochastic component. The sum of these two spectra should be very close to the frame-by-frame spectrum of the original sound. Both the sinusoidal and stochastic components have associated save and play buttons. For the sinusoidal component, the play button plays the current deterministic event, while the save button saves it. If the grouping option was not selected, the current deterministic event is simply the extracted sinusoidal tracks. If grouping was selected, each group of tracks is considered a separate deterministic event. In that case, the previous and next buttons can be used to navigate between multiple deterministic events found in a single round of analysis, and the all button resynthesizes and plays the sinusoidal tracks from all the events, as one unit. For the stochastic component, the save button needs to be pressed before the component can be played. This is to avoid wasting time on unnecessary inverse FFTs, in case the user is not interested in the stochastic part. Saving the stochastic part results in the required IFFTs being performed and the ensuing background sound being written to file. The clip only option should be specified (i.e. selected or not) before saving. If it is selected, the saved background consists of the clip of the original sound within the specified analysis time ranges, minus the extracted deterministic events. Otherwise, it saves as background the entire original sound minus the extracted deterministic events (this can be a bit clicky). Once the stochastic background has been saved, it can be listened to via the associated play button. When saving any component, a file dialog box is presented in case the user wants to save it externally as a .tap file. This is optional, and hitting "cancel" in the dialog box prevents it from being saved to file. In either case, the component is saved as a template in the internal TAPESTREA library, and can be reused in the synthesis face. The advantage of saving to file is that you can then load and access the template in later sittings, whereas the internal library version of it exists only as long as taps is running. This goes for transient event templates as well. Transient analysis The transients pane provides control over the transient detection parameters. Modifying these sliders updates the detected transients in real-time. Details on the parameters are available here. 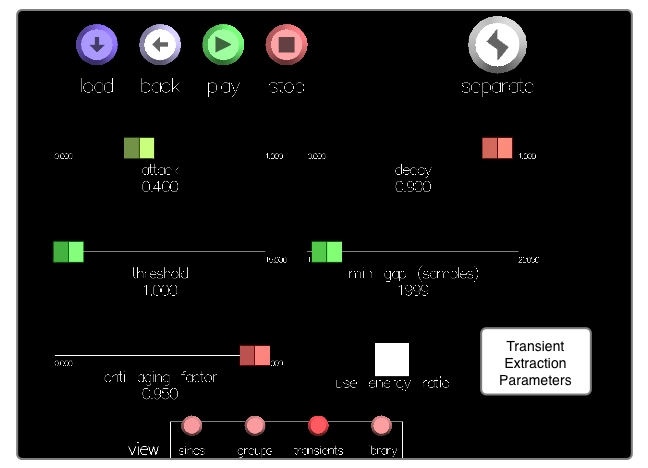
Figure 7 : Transient analysis pane The use energy ratio box in this pane (Figure 7), when selected, offers control over an alternate (and more dangerous) implementation of transient detection. The difference between the two implementations is briefly described on this page. The detected transients are highlighted in the waveform view of the original sound (top left quadrant) and can be listened to one at a time using the previous and next buttons, as with deterministic events. They can also be similarly saved as a template to file or to the library. Hitting the separate button while viewing the transients pane performs transient extraction. A residue with detected transients removed is then available in the stochastic background display at the bottom left. This, too, can be saved as a template and/or played. Iteration It is sometimes helpful to iteratively remove events to extract a cleaner background. The load me button near the stochastic background display facilitates this. Once a stochastic background has been computed, the load me button loads it into taps as the next file to be analyzed. All the standard analysis steps can then be performed on this background, including further levels of iteration. The back button near the center of the screen reloads the previous file that was being analyzed. For examle, a user can load an original sound, extract a background from it, load the background and play with it, find it unsatisfactory, and hit back to reload the original file. Note that the back button has a history of size 1. Raw template extraction To extract a raw template, select a rectangle on the spectrogram (or corresponding ranges in the waveform and spectrum views), and hit the separate button. The rolloff slider determines the frequency rolloff for the pass band as a fraction of the the Nyquist frequency. The frame-by-frame spectrum of the extracted region is then displayed at the bottom left. Hitting the play button beneath this spectrum lets you replay the template, while the save button allows it to be saved to the library or to disk. Additional keyboard controls One additional keyboard control is specific to the analysis face : L (shift + l) : toggle spectrogram rectangle line width (increase or decrease the line width for the spectrogram selection rectangle) |
taps | soundlab | cs | music